Puzzle Blueprint
Puzzle Blueprint
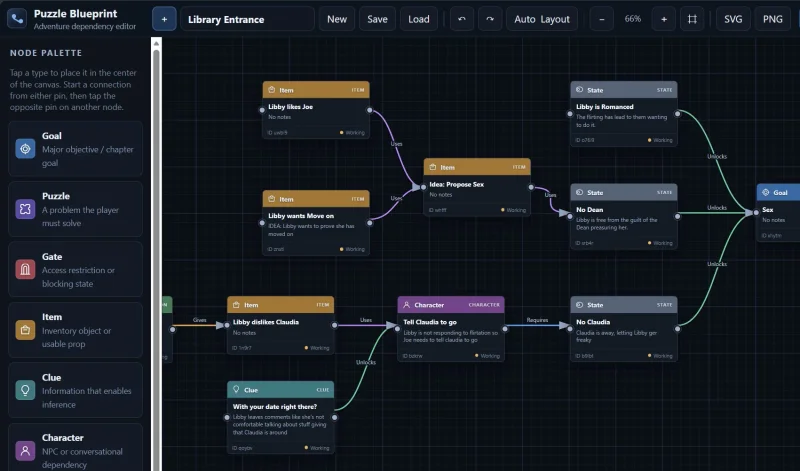
Puzzle Blueprint is a visual editor for mapping the dependencies inside an adventure-game puzzle. It is inspired by the Puzzle Dependency Charts used by Ron Gilbert and other designers at Lucasfilm Games to design classic adventure games.
A puzzle dependency chart is a way of seeing how the different parts of a puzzle connect to each other. Instead of writing the puzzle as a walkthrough, where the player does one thing and then the next, the chart shows what the player needs to do, find, learn, or change before other actions become possible.
For example, the player may need to open a locked door. To do that, they need a key. But getting the key may require distracting a character, and distracting that character may require solving a different problem somewhere else. The chart lets you see all of those dependencies at the same time.
This is especially useful for LucasArts-style puzzle design, where the player usually has several problems they can work on at once. Different puzzle branches can happen in parallel, connect to each other, and eventually come together. A puzzle dependency chart helps you see if the structure gives the player enough freedom, or if the puzzle has become too linear.
It can also help you find problems in the design. You can see bottlenecks, circular dependencies, dead ends, unnecessary steps, or moments where the player is expected to make an inference without having enough information.
Ron Gilbert explains the original method in his 2014 Grumpy Gamer post, Puzzle Dependency Charts. If you are new to this way of designing puzzles, I recommend reading his explanation first.
Puzzle Blueprint builds on this idea by helping organize objectives, obstacles, clues, items, locations, actions, and character interactions, and showing the relationships between them.
The editor runs as a standalone browser app. Graphs are saved locally in the browser and can also be exported as JSON, SVG, or PNG files.
Alpha
Puzzle Blueprint is currently in alpha. It is still an early version so some things may not work as intended. And I’m sure there are bugs I haven’t found.
The way graphs are stored or exported may also change between versions, so it is a good idea to export important graphs as JSON backups instead of relying only on browser storage.